Table of Contents
| DATA ANALYTICS REFERENCE DOCUMENT |
|
|---|---|
| Document Title: | Setting up Cygwin |
| Document No.: | 1570875139 |
| Author(s): | Gerhard van der Linde, Rita Raher |
| Contributor(s): | |
REVISION HISTORY
| Revision | Details of Modification(s) | Reason for modification | Date | By |
|---|---|---|---|---|
| 0 | Draft release | Document the setup of cygwin | 2019/10/12 10:12 | Gerhard van der Linde |
Cygwin debugger in VS Code
- Download and run the Cygwin installer from here https://cygwin.com/install.html
- After installation building is required, note that this is done in a newly installed Cygwin terminal.
- The module in the course uses gcc instead of g++.
Adding the gcc debugger gdb
Install gdb
Rerun the cygwin installer(setup-x86_64.exe), located in downloads or moved to cywin folder in c:\cygwin64
Click through the installer and select gdb, you might have to use search to locate it.
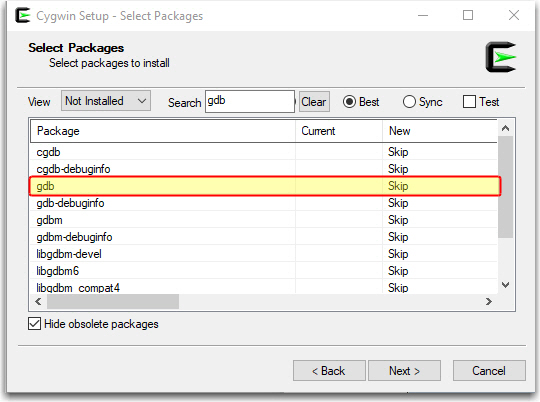
Click skip to select gdb and click net to complete the installation.
The gdb.exe file will now appear in c:\cygwin64\bin folder.
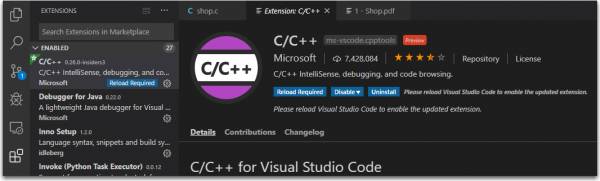
No set up the debugger extension in VS Code if not already installed.
The debugger can now be configured in VS Code.
Step by step instructions to set up the debugger in VS Code
- Open C file in VS Code
- Set breakpoint in code
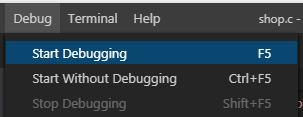
- Press F5 or select Start debugging from Debug menu
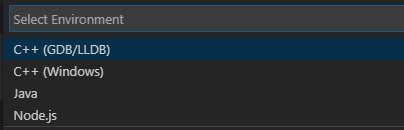
- Select C++(GDB/LLDB) from popup
- Then select gcc.exe build and debug active file
- The Launch.json window should now pop up, see that this has the right path to your gdb.exe file, save and close.
- G back to the C file and F5 again, ow it should pop up a message about not being able to build the active file, click “Configure Task”.
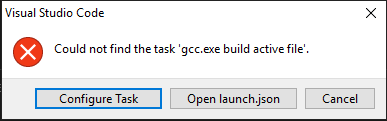
- Select C/C++:gcc.exe build active file
- Now the task,json file should pop up and confirm that “command” points to the right location where the gcc.exe file is located. Save and close
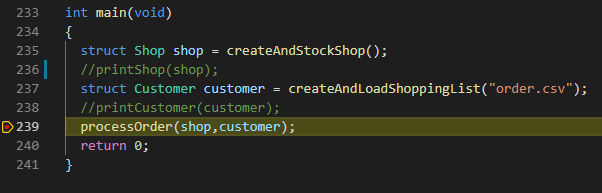
- Go back to the C file again and press F5.
- Now everything should start up and the code should stop at the debugger breakpoint.
Sample configuration files for Cygwin gdb to work in VS Code
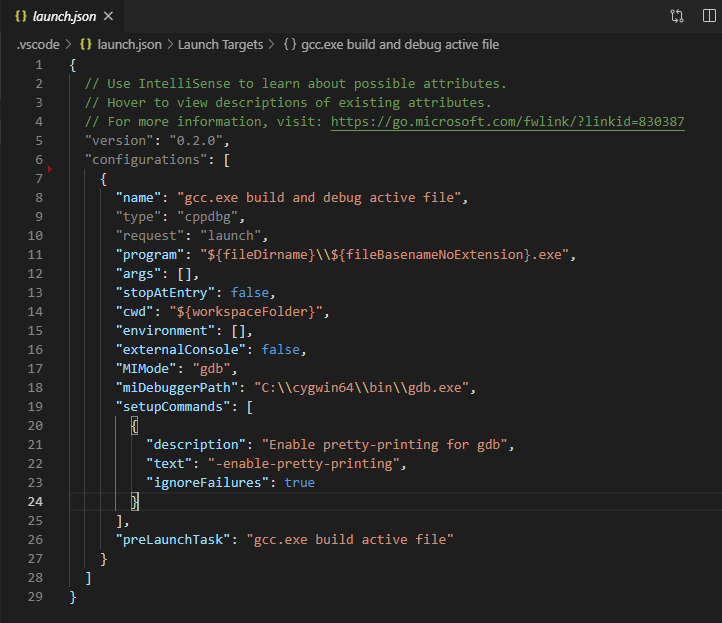
- launch.json
{
  // Use IntelliSense to learn about possible attributes.
  // Hover to view descriptions of existing attributes.
  // For more information, visit: https://go.microsoft.com/fwlink/?linkid=830387
  "version": "0.2.0",
  "configurations": [

    {
      "name": "gcc.exe build and debug active file",
      "type": "cppdbg",
      "request": "launch",
      "program": "${fileDirname}\\${fileBasenameNoExtension}.exe",
      "args": [],
      "stopAtEntry": false,
      "cwd": "${workspaceFolder}",
      "environment": [],
      "externalConsole": false,
      "MIMode": "gdb",
      "miDebuggerPath": "C:\\cygwin64\\bin\\gdb.exe",
      "setupCommands": [
        {
          "description": "Enable pretty-printing for gdb",
          "text": "-enable-pretty-printing",
          "ignoreFailures": true
        }
      ],
      "preLaunchTask": "gcc.exe build active file"
    }
  ]
}
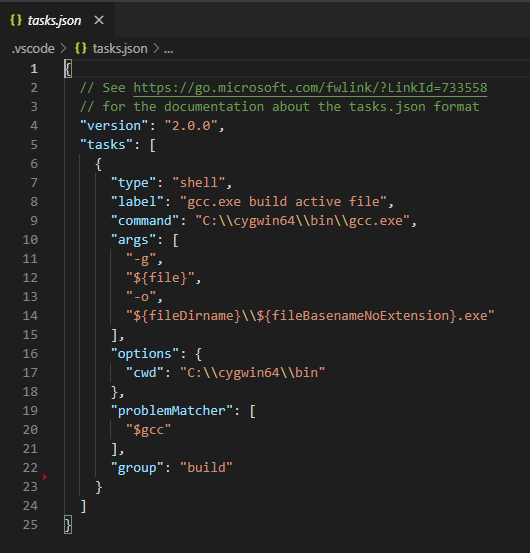
- tasks.json
{
  // See https://go.microsoft.com/fwlink/?LinkId=733558
  // for the documentation about the tasks.json format
  "version": "2.0.0",
  "tasks": [
    {
      "type": "shell",
      "label": "gcc.exe build active file",
      "command": "C:\\cygwin64\\bin\\gcc.exe",
      "args": [
        "-g",
        "${file}",
        "-o",
        "${fileDirname}\\${fileBasenameNoExtension}.exe"
      ],
      "options": {
        "cwd": "C:\\cygwin64\\bin"
      },
      "problemMatcher": [
        "$gcc"
      ],
      "group": "build"
    }
  ]
}
Right click and save the two json configuration files above into a subfolder named .vscode.
This folder should be in the same folder where your c files that you want to debug resides.
Troubleshooting
"logging": { "engineLogging": true }
UTF-8 Workaround
* https://github.com/microsoft/vscode-cpptools/issues/1527
So the issue is caused in gb and the extra escaped character returned on line three in the VS Code debugger window as shown below.
1: (2308) ->(gdb)
1: (2317) <-1001-gdb-set target-async on
1: (2318) ->&"\357\273\2771001-gdb-set target-async on\n"
1: (2319) ->&"Undefined command: \"\".  Try \"help\".\n"
1: (2320) ->^error,msg="Undefined command: \"\".  Try \"help\"."
1: (2320) ->(gdb)
As a workaround to fix this add a “gdb-with-chcp.cmd” within to your project (eg, “c:\cywin64\bin\gdp-with-chcp.cmd”):
@:: gdb-with-chcp.cmd
@chcp 1257 >NUL 2>&1 && @"gdb.exe" %*
This sets the codepage for GDB and fixes the problem cause above when running the PC set to UTF-8 codepage.
Amend the current json code launching the debugger to point to the cmd file just created.
- launch.josn
  // use "PATHTO/gdb-with-chcp.cmd" as "miDebuggerPath" within "launch.json"
  // eg
  // ...
  "miDebuggerPath": "${workspaceFolder}/dbin/gdb-with-chcp.cmd",
  // ...
This resolved my gcc debugger issues.