Table of Contents
| DATA ANALYTICS REFERENCE DOCUMENT |
|
|---|---|
| Document Title: | 52446 - Fundamentals of Data Analysis summary document |
| Document No.: | 1540204647 |
| Author(s): | |
| Contributor(s): | Rita Raher, Gerhard van der Linde |
REVISION HISTORY
| Revision | Details of Modification(s) | Reason for modification | Date | By |
|---|---|---|---|---|
| 0 | Draft release | Referene document to summerise module coverage | 2018/10/22 10:37 | Gearoid O'Gcrannaoil |
52446 - Fundamentals of Data Analysis
Learning outcomes
On completion of this module the learner will/should be able to:
- Source and investigate sets of data.
- Programmatically explore and visualise data.
- Apply basic mathematical data analysis techniques to data sets.
- Write programs to automate basic data analysis techniques.
Indicative syllabus
The following is a list of topics that will likely be covered in this module. Note that the topics might not be presented in this order and might not be explicitly referenced in course materials.
Acquisition
Searching for data sets, file formats, data structures.
Exploration and visualisation
Calculating summary statistics, programmatically generating plots, histograms, scatter plots, box plots.
Data cleansing
Character sets, search and replace, regular expressions, outlier identification.
Mathematical techniques
Ordinary linear regression, classification.
Programming
Programmatically applying data analysis techniques, automating data analysis workflows.
Win a car (Probability)
This week you'll play a simple game of chance in Python.
Jupyter is a piece of software written in Python for displaying and presenting Python code, it's outputs and some documentation. In later lectures you will learn to create your own notebooks. For now, just watch the accompanying video, run this notebook on your own machine, and submit the result of running it in to the link below as specified in the notebook itself.
- How to run a Jupyter notebook on your own machine.1) Future notes will come in the form of Jupyter notebooks, so it's crucial that you learn how to run them now. It'll be a little cumbersome at the start, but it will be worth it in the long run.
- How to download a Jupyter notebook2), run it on your own machine, edit it, and then save it and submit it to the Moodle page.
- How to run the Jupyter notebook below and submit the results to the submission page below that.
Monty Hall problem (Probability)
This week we'll analyse the Win a car problem.
- An analysis of the student submissions to date from the win a car notebook. Please note that the notebook and CSV file from this video are not available to students.
- A discussion of the Monty Hall problem and its simulation in Python.
- Jupyter notebook used in the Monty Hall problem3).
Observations
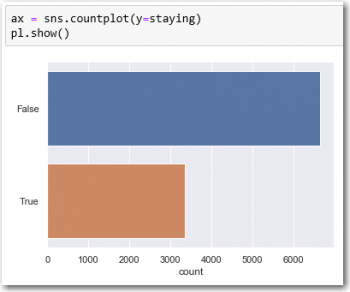
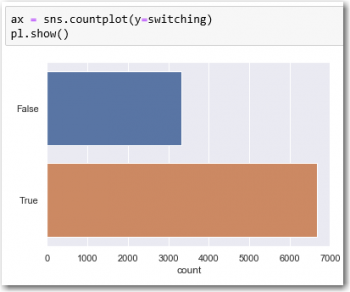
Running the game file from link above for 10,000 cycles produces two datasets with very different outcomes.
There seems to be a clear probability advantage changing your choice once the goat was revealed.
Lady tasting tea (Hypothesis testing)
This week we'll look at the problem that founded modern hypothesis testing.
- Introduction to the Lady Tasting Tea problem.
- Setting up a repository to analyse the problem.
- Understanding all of the possibilities.
- The null hypothesis.
- The distribution of the possibilities.
- Concluding the problem investigation.
- Notebook (cleaned up) from the videos.
Understanding all the possibilities
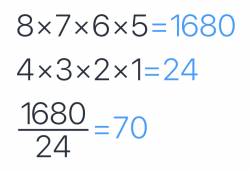
- There are 1680 ways to choose a first cup, a second cup, a third cup and a fourth cup in order.
- There are 24 ways to order the four cups
- So the number of ways to choose four cups out of eight is 70.
- So the probability of identifying all 4 cups correctly is 1/70
This approach in my opinion assumes a very good grasp and knowledge of mathematics and an intuitive feel for factorials4) I could eventually figure out the flow of the math and reproduce the results but if I have to come up with the algorithm from scratch without references to the article I am afraid that might just fail.
Playing with itertools5) however and some basic python code made much more sense to me and analysing this all more from a language perspective started to make much more sense form me at least.
So looking at itertools, the two functions of interest in this exercise is combinantions6) and permutations7).
In [103]: n=list(range(4))

In [106]: n
Out[106]: [0, 1, 2, 3]

In [104]: list(iter.combinations(n,3))
Out[104]: [(0, 1, 2), (0, 1, 3), (0, 2, 3), (1, 2, 3)]

In [105]: list(iter.permutations(n,3))
Out[105]:
[(0, 1, 2),
 (0, 1, 3),
 (0, 2, 1),
 (0, 2, 3),
 (0, 3, 1),
 (0, 3, 2),
 (1, 0, 2),
 (1, 0, 3),
 (1, 2, 0),
 (1, 2, 3),
 (1, 3, 0),
 (1, 3, 2),
 (2, 0, 1),
 (2, 0, 3),
 (2, 1, 0),
 (2, 1, 3),
 (2, 3, 0),
 (2, 3, 1),
 (3, 0, 1),
 (3, 0, 2),
 (3, 1, 0),
 (3, 1, 2),
 (3, 2, 0),
 (3, 2, 1)]
So essentially combinations does not repeat the same numbers and permutations cares about the order too, so repeats the numbers as long as the exact sequence is not repeated.
So then having cleared this up, it makes sense then, to me at least, that from a list of eight cups I can make 70 unique selections of 4 as confirmed by my python function.
In [177]: len(list(iter.combinations(cups,4)))
Out[177]: 70
So the correct sequence of cups is one of the set of 70, therefore theodds of randowmly select this correct sequence is 1/70.
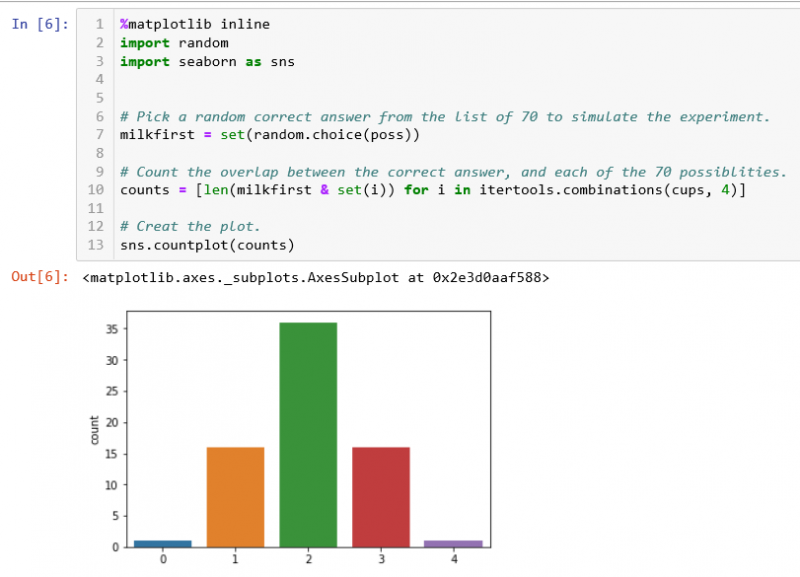 The last part of the notebook then explains the overlap scenario and the logic for rejecting a three out of four selection because of the overlap probabbility count of 15 item out of 70, i.e. <m>15/70=21.43%</m>. So even worse for 2 out of for with a 50% chance.
So testing for overlap in a set to determine the frequency of a subset to decide if the occurance can justify rejecting the null hypotheses8).
Drug testing (Bayes' theorem)
This week we'll use Bayes' theorem to analyse tests.
- An introduction to Bayes theorem.
- A discussion of a real world problem surrounding drug testing with Bayes' theorem.
- A discussion of basic probability theory in the context of Bayes' theorem.
- Simulation of a problem involving Bayes' theorem.
- An analysis of a real-world problem using Bayes' theorem.
- The note book used in the above videos.9)
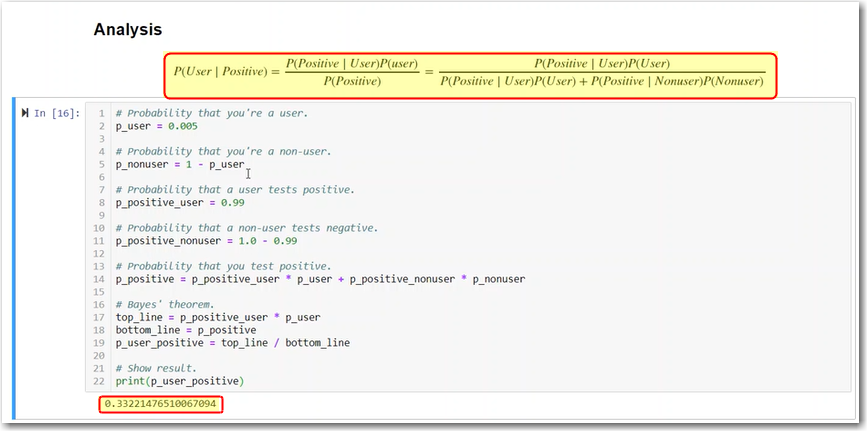
Baye's Theorum
<m 16>P({A}delim{|}{B}{})={P({B}delim{|}{A}{}){P(A)}} /{P(B)} </m> formula help
Simulation of Bayes
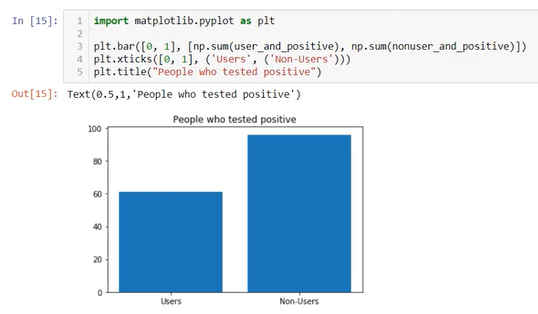
Analyses of drug test using Bayes
Noise and simple linear regression
This week we'll look at simple linear regression and noise in simulated data.
- An introduction to this video series.
- A video explaining the regression problem.
- Simulating an experiment in numpy.
- Explanation of what a linear model is.
- The best fit line for the data set.
- A notebook on simple linear regression.10)
- linear_regression.py
# import the libraries we need for number crunching and plotting
import numpy as np
import matplotlib.pyplot as pl

#generate random data for the experiment
#generate a series w from zero to 20
w = np.arange(0.0, 21.0, 1.0)
#generate a linear series y=mx+c using m=5 and c=10 and add some random offsets to it
d = 5.0 * w + 10.0 + np.random.normal(0.0, 5.0, w.size)

# find thevalues of m and c from the randowm data generated
m,c=np.polyfit(w,d,1)

#plot the dataset and the linear fit derived above
pl.plot(w, m * w + c, 'b-', label='Best fit line')
pl.plot(w,d,'k.')

pl.show()

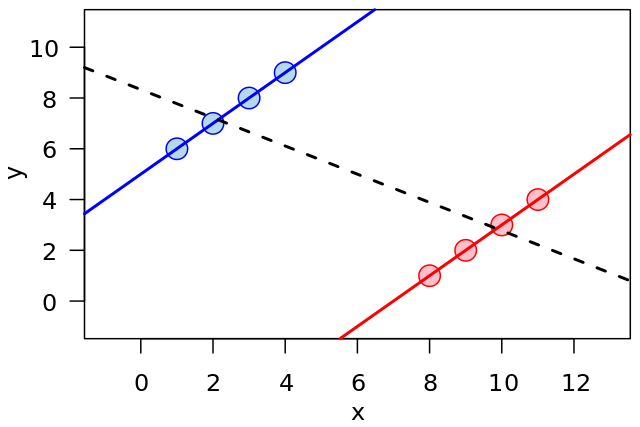
Iris (Classification)

This week we'll look into Classification.
- Revisiting the Iris data set.
- Classification: using 150 data points to predict the iris flower type based on iris measurements (sepal length, sepal width, petal width, petal length)
- Discussing the different types in data in the Iris data set. The class variable is a categorical variable. Categorical variables are used in surveys.
- What is k nearest neighbours? It will plot the newest point on a plot and measure the distance from 150 points. Then it picks the closest ones to newest point and classes the point based on the class of the majority.
- The notebook used in these videos.11)
Summary in code
import sklearn.neighbors as nei
import pandas as pd
import sklearn.model_selection as mod

# Load the iris data set from a URL.
df = pd.read_csv("https://github.com/ianmcloughlin/datasets/raw/master/iris.csv")

inputs = df[['sepal_length', 'sepal_width', 'petal_length', 'petal_width']]
outputs = df['class']

knn = nei.KNeighborsClassifier(n_neighbors=5)

knn.fit(inputs, outputs)

knn.predict([[5.6, 2.8, 4.9, 2.0]])

n=(knn.predict(inputs) == outputs).sum() # how many out of 150 is predicted right

print(n)

#Split into training and test set using 'train_test_split', using a third of the set selected randomly

inputs_train, inputs_test, outputs_train, outputs_test = mod.train_test_split(inputs, outputs, test_size=0.33)


knn = nei.KNeighborsClassifier(n_neighbors=5)
knn.fit(inputs_train, outputs_train)

n=(knn.predict(inputs_test) == outputs_test).sum()
print(n)
Groups (Simpson's paradox)
Cognitive bias
A heuristic is a rule that provides a shortcut to solving difficult problems. Heuristics are used when you have limited time and/or information to make a decision. Heuristics lead you to a good decision most of the time. Heuristics are discussed in both computer science and psychology circles.
A bat and ball cost $1.10.
The bat costs $1 more than the ball.
How much does the ball cost?
So the “obvious” answer is wrong, it is not 10c but 5c.
<m>bat+ball=1.10</m>
<m>ball+1=bat</m>
<m>right (ball+1)+ball=1.10</m>
<m>right ball+ball=1.10-1</m>
<m>right ball=0.05</m>
12)
All roses are flowers.
Some flowers fade quickly.
Therefore some roses fade quickly.
So some roses will not necessarily form part of the some flowers collection, so as a result might not fade at all.
Linda is 31 years old, single, outspoken and very bright. She majored in philosophy. As a student she was deeply concerned with issues of discrimination and social justice and also participated in antinuclear demonstrations.
Which is more likely?
a. Linda is a bank teller.
b. Linda is a bank teller and active in the feminist movement.
Most people that answered the study chose “b”, but it's a fallacy from a mathematical perspective. B is true when A is true, so the question creates the potential for the fallacy, also the blurp suggests the answer and being a bank teller is much more likely than both….
Conjunction fallacy - The mistake is choosing the answer within another answer…
Higher chance of being right answering A.
Would you accept this gamble?
50% chance to win $150
50% chance to lose $100
Utility Theory <m>0.5 x 150 - 100 x 100 = 25</m> on average win…
Most people will not take the gamble. Tipping point, twice as big gain, then people will start taking on the risk…
Risk aversion, don't like to lose…
A person who is asked “What proportion of long-distance
relationships break up within a year?” may answer as if
been asked “Do instances of swift breakups of long-distance
relationships come readily to mind?”
The availability heuristic. If asked a question, the person answering would recall recent event to answer the question and might no represent the norm, for example how many fruits eaten and think about yesterday only and l=not long term…
Sampling bias occurs when the units that are selected from the population for inclusion in your sample are not characteristic of (i.e., do not reflect) the population. This can lead to your sample being unrepresentative of the population you are interested in. For example, you want to measure how often residents in New York go to a Broadway show in a given year. Clearly, standing along Broadway and asking people as they pass by how often they went to Broadway shows in a given year would not make sense because a higher proportion of those passing by are likely to have just come out of a show. The sample would therefore be biased. For this reason, we have to think carefully about the types of sampling techniques we use when selecting units to be included in our sample. Some sampling techniques, such as convenience sampling, a type of non-probability sampling (which reflected the Broadway example above), are prone to greater bias than probability sampling techniques. We discuss sampling techniques further next.
Databases (sqlite3)

Summary of the essentials
- sqlite.py
import sqlite3  # load the SQLite library
conn = sqlite3.connect('data/example.db') # open a local database file
c = conn.cursor() # create a cursor c

#read three csv files in
person = pd.read_csv("https://github.com/ianmcloughlin/datasets/raw/master/cars-db/person.csv", index_col=0)
car = pd.read_csv("https://github.com/ianmcloughlin/datasets/raw/master/cars-db/car.csv", index_col=0)
county = pd.read_csv("https://github.com/ianmcloughlin/datasets/raw/master/cars-db/county.csv", index_col=0)

#convert and save csv files to the database
county.to_sql("county", conn)
person.to_sql("person", conn)
car.to_sql("car", conn)

# run a query to show all the tables created above
c.execute("SELECT name FROM sqlite_master WHERE type='table'")
c.fetchall()

# run a query with a joinbetween two tables
c.execute("""
    SELECT p.Name, c.Registration, p.Address
    FROM person as p JOIN car as c ON p.ID = c.OwnerId
""")
c.fetchall()

# run a query with a join between three tables
c.execute("""
    SELECT p.Name, c.Registration, p.Address
    FROM person as p
         JOIN car as c ON p.ID = c.OwnerId
         JOIN county as t ON t.Name = p.Address
    WHERE c.Registration NOT LIKE '%-' + t.Registration + '-%'
""")
c.fetchall()

# close the connection
conn.close()
Notebooks and Repositories: Github
![]() Getting started
Getting started
- Create a new repository on github
- Add a Description
- Make it public - so Ian can see it ;)
- Add a nice readme - make sure to correctly explain what your project is about and have a good description
- Add .gitignore
- Add MIT License
- Copy url
- git clone 'url'
- code . opens up the current folder
- jupyter notebook - opens jupyter
- Create a new notebook
- Make sure to give the notebook a proper name…
- Don't include the .ipynb_checkpoints file in github
- use .gitignore to exclude the file.
The Jupyter Notebook - How to nicely present my work
- Give the notebook a level 1 heading
- Make sure to add more details to readme.md - This repo contains a jupyter notebook with an investigate into XXXX dataset. To run this notebook you must have jupyter installed on your machine. You can install this with the anaconda distribution. The notebook is called XXX. You can view this file in nbviewer.
- git push to github
Working on the dataset
- import pandas as pd
- add explainer text in the comments
- data folder
- use github raw url
Adding images
- using relative path: 
- github → image folder → download→ copy url 
- google image url → 
One notebook is plenty - less hassle for the reader
Note: Be more descriptive about the data when you are going through the notebook. Why is dataset interesting? Give a high level flavour about what is going on. Tell a story