| DATA ANALYTICS REFERENCE DOCUMENT |
|
|---|---|
| Document Title: | Setting up Visual Studio code debugger for Python |
| Document No.: | 1551184524 |
| Author(s): | Gerhard van der Linde |
| Contributor(s): | |
REVISION HISTORY
| Revision | Details of Modification(s) | Reason for modification | Date | By |
|---|---|---|---|---|
| 0 | Draft release | Drafting Setting up Visual Studio code debugger for Python | 2019/02/26 12:35 | Gerhard van der Linde |
VS Code Debugger Setup
Setup
Draft version, might be incomplete or contain errors, please proceed with caution and make backups before making changes.
In order to run pythin code in the visual studio code debugger, you need at a minimium to install the python debugger extension. There are sevral to choose from, but the highest rated and most popular one is what I installed.
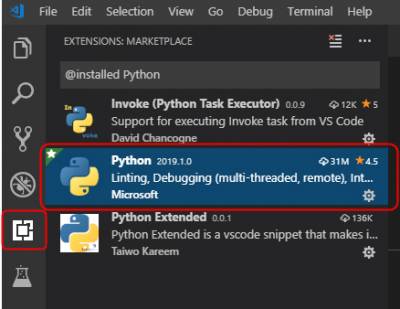
- So select the extensions icon highlighted on the left and type “python” in the search bar.
- Select the install button and follow ythe promts to complete and reload the extension to make it available.
- Some optional steps my be required to set up the configuration, but the defaults should be sufficient
A help file is available and should pop up after the install too.
The next step is to write some code and debug it. Write the python and the select the debug icon from the toolbar on the left.
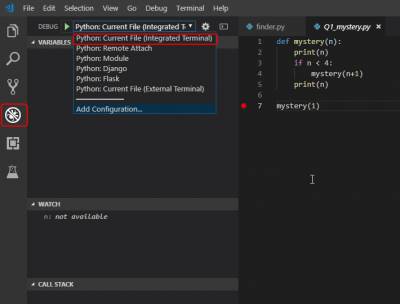
- Next select the debugger profile from the dropdown list, i.e. “Python: Current File (Integrated Terminal)” option.
- Then set a breakpoint in the code, click in the margin next to line 7 as shown in the sample until you have a red dot too.
- Now select either from the menu Debug –> Start degug, of F5 or the green right arrow to start debugging.
- The select F11, or step into or click on the debug toolbar on the down arrow with a dot below it
- Now watch the variables and the call stack as you step.
You can click on the stack to see the variables stacked inside the calls.
Stepping through the code shows you exactly what is happening and repeating this several times might be required for things to make sense.
Use Case
Launching the debugger can be quite resource intensive and can be slow, meaning that there needs to be some time delay between using F5 and F11. Please wait for the debugger to launch completely before trying to step through the code.
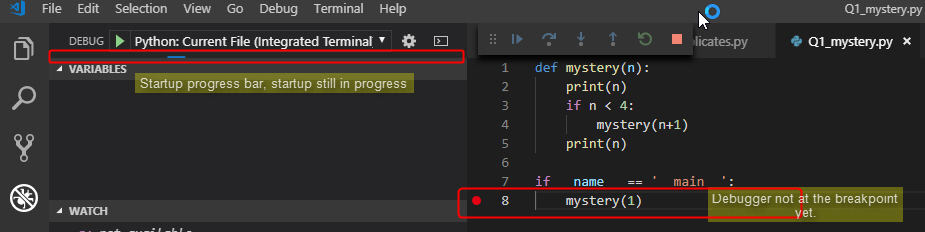
Not the thin blue line in the progress bar indicating the launch of the debugger on first time use after starting VS Code, it can take up to 30 seconds depending on the PC and background process load.
Also note the lack of a yellow triangle and highlighted line around the breakpoint on line 8 in the code.
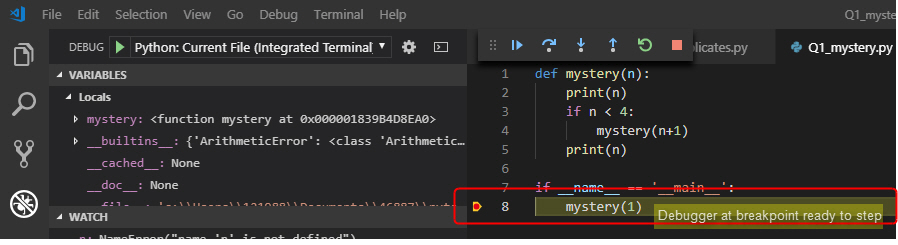
In the second screenshot you can now see that the debugger is ready to step. Note the yellow triange around the breakpoint and the highlighted area around line 8 indicating the step position. At this pint you should be ready to step through the code using F11, or other options to step in the taskbar or Debug menu.
For illustration purposes, let's consider a use case using the folowing code.
- mystery.py
- def mystery(n):
- print(n)
- if n < 4:
- mystery(n+1)
- print(n)
- if __name__ == '__main__':
- mystery(1)
So firstly, note that mystery is calling itself on line 4 of the code sample untill n is equal to four.
First add a breakpoint to the line calling the fiunctio, so line eight from the code above, then launch the debugger with F5 and when the debugger is ready step through the code using F11.
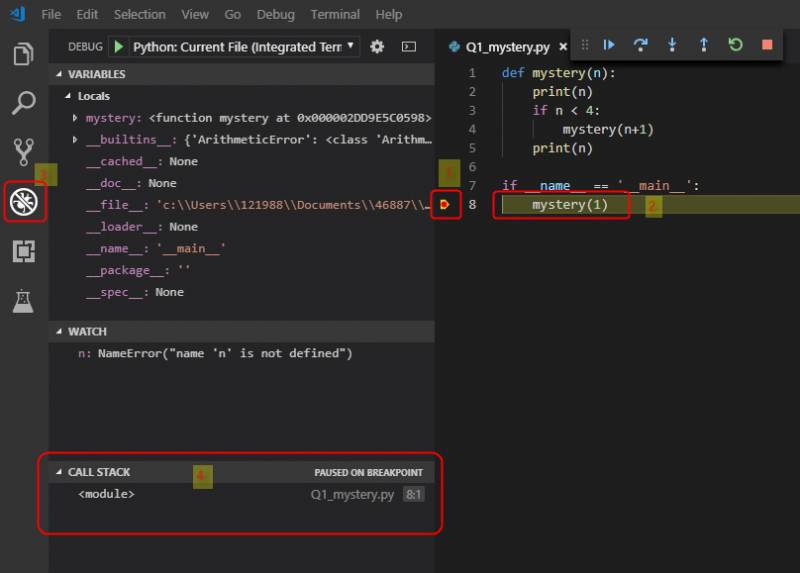
- The breakpoint is set and launching the debugger with F5 the code will stop and wait at line 5 to proceed with F11 or similar.
- The line mystery(1) will also be highlighted to show the debugger position
- The debugger icon on the toolbar on the left is selected and highlighted
- The call stack only shows <module>, every call to “mystery” will pile up on the stack.
Step through the code and observe the variable under and Watch windows and observe the call stack changing…
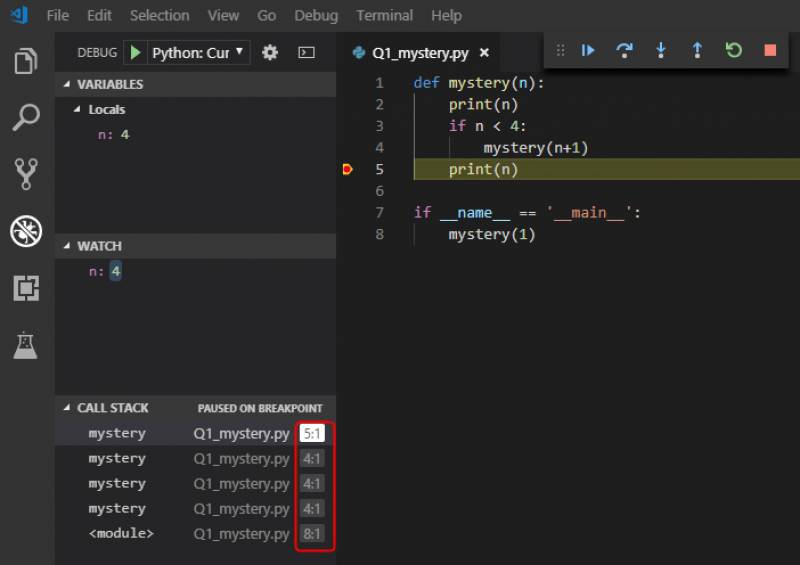
The second scenario add a breakpoint to line 5, this will result in the stack piling up untill the value of n is four.
The top of the stack is the function mystery paused on line five and the rest of the calls on the stack paused on lines four. As soon as you step over the print function to top stacked call to mystery completes and prints the values of n held in the stacked function mystery. Clicking on the other stacked values you can see the values of n that is held in them and watching them pop off you can see what values of n are held in them and being printed.
So mystery prints the values pushed onto the stack before it happens and then pop them in reverse order from the stack again and prints the values of n again. This really demonstrates FILO1) behavior of the stack.
Amending or viewing the configurations(optional)
At the bottom of the dropdown list is an option “Add configuration”
This opens a launch.json file, mine looks like this:
{
    // Use IntelliSense to learn about possible attributes.
    // Hover to view descriptions of existing attributes.
    // For more information, visit: https://go.microsoft.com/fwlink/?linkid=830387
    "version": "0.2.0",
    "configurations": [


        {
            "name": "Python: Current File (Integrated Terminal)",
            "type": "python",
            "request": "launch",
            "program": "${file}",
            "console": "integratedTerminal"
        },
        {
            "name": "Python: Remote Attach",
            "type": "python",
            "request": "attach",
            "port": 5678,
            "host": "localhost",
            "pathMappings": [
                {
                    "localRoot": "${workspaceFolder}",
                    "remoteRoot": "."
                }
            ]
        },
        {
            "name": "Python: Module",
            "type": "python",
            "request": "launch",
            "module": "enter-your-module-name-here",
            "console": "integratedTerminal"
        },
        {
            "name": "Python: Django",
            "type": "python",
            "request": "launch",
            "program": "${workspaceFolder}/manage.py",
            "console": "integratedTerminal",
            "args": [
                "runserver",
                "--noreload",
                "--nothreading"
            ],
            "django": true
        },
        {
            "name": "Python: Flask",
            "type": "python",
            "request": "launch",
            "module": "flask",
            "env": {
                "FLASK_APP": "app.py"
            },
            "args": [
                "run",
                "--no-debugger",
                "--no-reload"
            ],
            "jinja": true
        },
        {
            "name": "Python: Current File (External Terminal)",
            "type": "python",
            "request": "launch",
            "program": "${file}",
            "console": "externalTerminal"
        }
    ]
}
The plugin help file has some hints on configuration, remember to save the changes you made in order for them to take effect. Also don't just copy the config above, you might not have all the plugins installed that I have.